Temparatures in Serengeti
Although popular image dictates that Africa is mostly a very hot place, Serengeti’s climate is actually very pleasant and moderate. It seldom gets uncomfortably hot, and temperatures drop during the night and early mornings. The minimum and maximum temperatures vary with the seasons, with the wet season being the warmest. The Seronera area rarely exceeds 37 °C on a hot afternoon in the rainy season, and hardly ever dips below 13 °C on a cold early morning in the dry season.
The average maximum daily temperature changes with elevation: from 15°C near the crater highlands to about 30°C near Lake Victoria. Because of its altitude, Serengeti National Park is a ‘cool island' in a much warmer region.
Rainfall periods in Serengeti
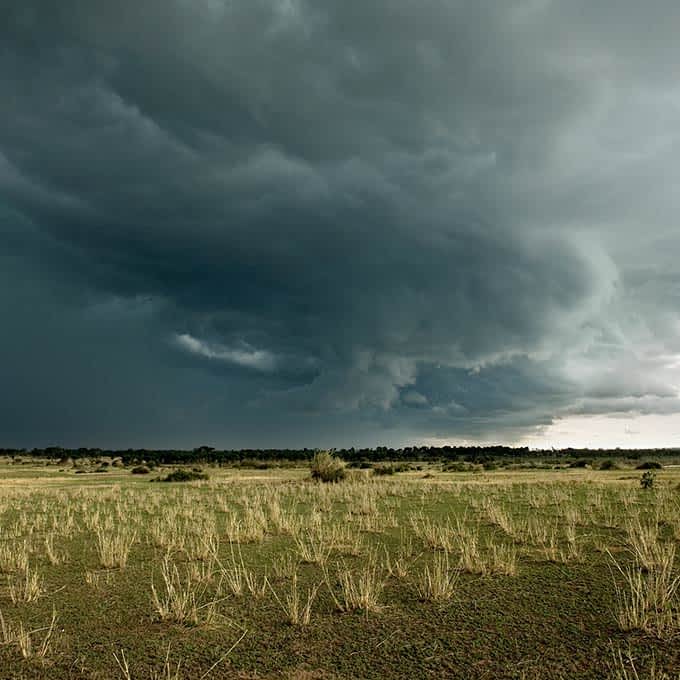
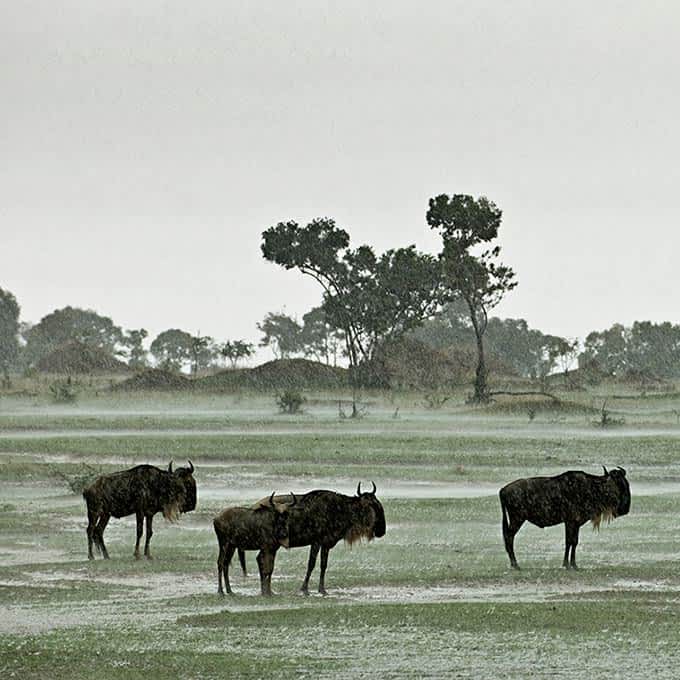
There are two rainy periods in Serengeti National Park. The short rains from November to December are the first to break the grip of the dry season. These rains are unpredictable and are unlikely to interfere with your safari. The long rains follow the short rains in the period from March to May, which are the highest rainfall months. It seldom rains for the entire day, but please remember that it rains on most days. As a result, the landscape turns green and as a result this season is often dubbed the ‘green season’. Sometimes the rains fuse into one extended period, particularly in the north. Or the short rains may fail entirely, especially in the southeast of the Serengeti.
Rainfall gradient
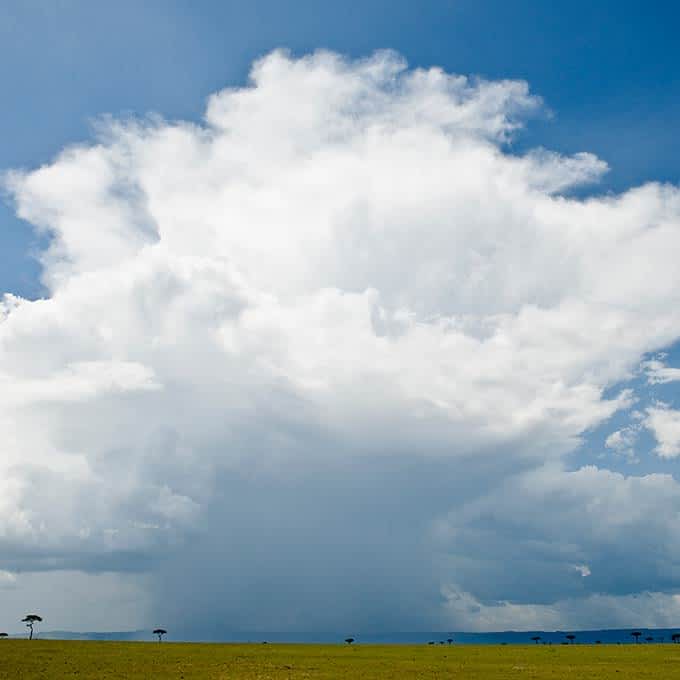
There is a rainfall gradient from the dry southeast plains (400 mm per year) to the much wetter northwest near the Kenyan border and the Masai Mara (up to 1,200 mm per year). The low rainfall on the Serengeti plains is caused by the rain shadow of the Ngorongoro Crater Area and the Meru-Kilimanjaro mountain range. Prevailing south-easterly winds carrying moisture off the Indian Ocean are forced to rise over these highlands. As the air cools the moisture condenses and the water in the air rains out. However, shifting winds can carry moisture back inland from Lake Victoria, counteracting this effect, and inducing this rainfall gradient.
Serengeti climate charts
| |
JAN |
FEB |
MAR |
APR |
MAY |
JUN |
JUL |
AUG |
SEP |
OCT |
NOV |
DEC |
| Max °C |
29 |
29 |
29 |
28 |
27 |
26 |
26 |
27 |
28 |
28 |
28 |
28 |
| Min °C |
26 |
16 |
16 |
16 |
15 |
15 |
14 |
15 |
15 |
16 |
16 |
16 |
| |
JAN |
FEB |
MAR |
APR |
MAY |
JUN |
JUL |
AUG |
SEP |
OCT |
NOV |
DEC |
| |
80 |
100 |
135 |
160 |
90 |
25 |
15 |
30 |
60 |
70 |
115 |
105 |
Further reading

